

Key Takeaways: Flight log analysis is the difference between guessing at problems and seeing the data. This tutorial covers PX4’s ULog format and the Flight Review tool, walking through four real-world diagnostic cases: excessive vibration (FFT analysis), EKF anomalies (innovation spikes), power supply issues (voltage sag fingerprints), and PID response problems (oscillation characteristics). You’ll also learn Python + pyulog automation for batch analysis. At Aomway, we treat log analysis as a mandatory skill—data doesn’t lie, and complete flight records make every diagnosis reproducible.
Opening: From “Guessing Problems” to “Seeing Data”
After years of flight controller support work, I’ve found that frontline engineers generally troubleshoot problems in two ways.
The first way: guess from experience. “This jitter is probably the PID D value being too high.” “This drift is probably a GPS issue.” “This reboot is likely the power supply.” When the guess is right, efficiency is high; when wrong, you can waste three days tuning an irrelevant parameter. More critically, this approach can’t be reproduced or transferred—the senior engineer guessed right, but juniors learn nothing.
The second way: locate with data. Pull the log, look at waveforms, spectra, and statistics—let the data speak. Which sensor the problem comes from, when it started, how badly it degraded, and how it correlates with other signals—all of it can be read from the data.
The second approach may be slower initially (you spend time learning tools and reading data). But once it becomes a habit, both accuracy and speed of problem location far exceed “guessing.” And data doesn’t lie—logs record objective facts, not subjective judgments.
For industrial-grade flight controllers, log analysis isn’t a “bonus”—it’s a “required course.” Well-designed boards embed high-reliability data recording modules—large-capacity SD cards, complete sensor data stream logging, power-loss protection mechanisms—ensuring full flight data is preserved. With this data foundation, analysis becomes meaningful.
This article is a hands-on tutorial. Using PX4’s ULog format and the Flight Review tool as the main thread, it walks through log analysis methods step by step through four real cases. If you’re new to log analysis, this gets you started quickly. If you already have experience, the automated analysis scripts at the end should be useful.
PX4 ULog Format Explained
ULog is PX4’s default log format, with the file extension .ulg. Its design philosophy is “structured + multi-topic”—a single ULog file contains time-series records of all sensor data, control outputs, state estimates, and system events during flight controller operation.
ULog file structure has three layers:
Layer 1: File Header. Contains log format version, timestamps, and a unique UUID identifier. The header also defines the data encoding method for the entire log.
Layer 2: Format Definitions. Defines the structure of all data topics in the log. Each topic has a name, field list, and field types. For example, the sensor_combined topic contains accelerometer, gyroscope, and magnetometer sample data, with each field annotated with its data type and unit.
Layer 3: Data Section. All topic data messages arranged in chronological order. Each message is preceded by a length marker and topic ID for decoding.
Common key topics include:
| Topic Name | Content | Typical Rate |
|---|---|---|
sensor_combined |
Accelerometer, gyroscope, magnetometer (synchronized) | 250Hz |
vehicle_gps_position |
GPS position, velocity, accuracy | 5-10Hz |
vehicle_attitude |
Attitude quaternion, Euler angles | 250Hz |
vehicle_local_position |
Local frame position, velocity | 250Hz |
actuator_outputs |
Motor/PWM outputs | 250Hz |
vehicle_control_mode |
Control mode | Event-driven |
estimator_status |
EKF status, innovations, etc. | 100Hz |
battery_status |
Voltage, current, remaining charge | 1Hz |
cpuload |
CPU load | 1Hz |
ekf2_innovations |
EKF innovation data | 100Hz |
How to obtain log files. PX4 flight controllers typically write ULog data to an onboard SD card. Well-designed industrial flight controllers embed high-reliability SD card slots—with spring-lock mechanisms to prevent vibration loosening, industrial-grade SD cards (wide temperature range -40°C to 85°C), and filesystem-level write integrity protection (to prevent log corruption from sudden power loss).
Two ways to download logs: transfer wirelessly via ground station software (QGroundControl) log management, or remove the SD card and copy with a card reader. The former is convenient but slower (hundreds of KB/s); the latter is fast but requires disassembly. For daily debugging, wireless transfer is recommended; for batch analysis, card removal is better.
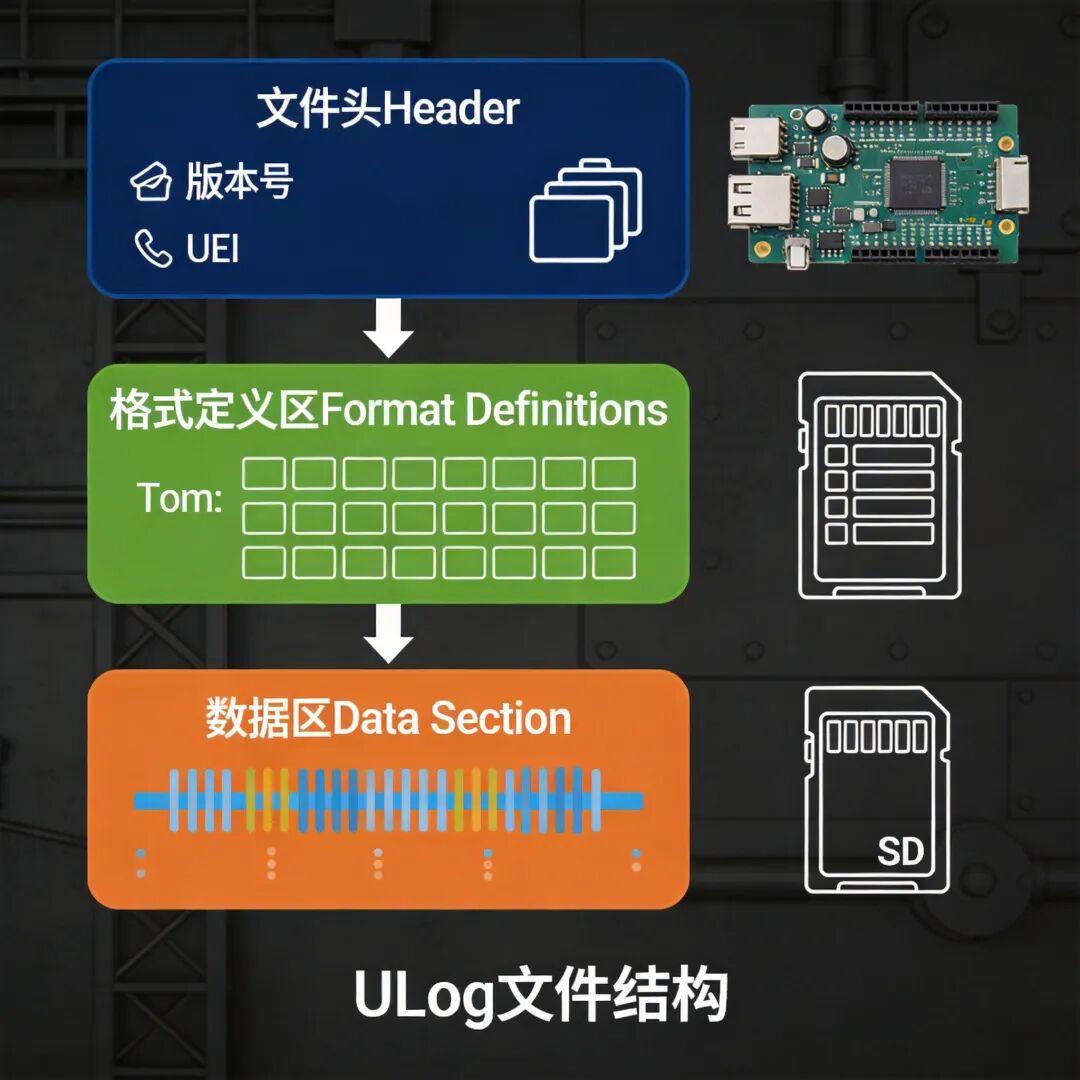
The image above shows the three-layer structure of a ULog file. The header defines encoding format and identification info, format definitions describe the structure of all data topics, and the data section records actual sensor and control data in chronological order. Understanding this structure makes custom analysis with pyulog more efficient.
Using the Flight Review Tool
Flight Review is PX4’s official online log analysis tool, at logs.px4.io. It parses ULog files into intuitive chart pages covering most common diagnostic needs.
Usage is very simple: open the Flight Review website, click the upload button, select the .ulg file, and wait for parsing to complete. A typical 30-minute flight log is 50-200MB; upload and parsing take about 1-3 minutes.
The Flight Review analysis page has multiple tabs, each focusing on a different dimension:
Overview page. The first page you see after opening a log. Shows basic flight info: flight duration, max altitude, max speed, max acceleration, battery consumption, CPU load, and flight modes used. Use this page for a quick understanding of overall flight health and to spot obvious anomalies.
Position page. Shows 2D/3D views of the flight trajectory plus position/velocity vs. time curves. Can overlay expected values (waypoint plan data) for direct comparison of track deviation.
Altitude page. Shows altitude estimate changes, including barometer altitude, GPS altitude, and EKF fused altitude comparisons. Altitude hold jitter issues are immediately clear on this page.
Velocity page. Shows velocity components on three axes plus total speed. Assesses velocity loop control quality—sustained oscillation in the velocity curve means velocity loop PID parameters need adjustment.
Tracking page. A critical page. Shows “expected vs. actual” comparisons for each control loop—attitude angle tracking, angular rate tracking. Obvious deviation or phase lag between expected and actual indicates insufficient control loop bandwidth or latency issues.
Sensors page. Shows raw sensor data including accelerometer, gyroscope, and magnetometer outputs. Visually inspect noise levels, abnormal jumps, and saturation clipping.
Power page. Shows battery voltage and current trends. Power issues—like voltage sag and current spikes—are immediately visible here.
System page. Shows system-level info including CPU load, memory usage, and dropped message counts. CPU load persistently above 80% is a warning sign—the flight controller’s compute resources are near their limit and may not complete control calculations in time during critical moments.
FFT Analysis page. Performs fast Fourier transforms on accelerometer and gyroscope data to generate frequency-domain spectra. This is the core tool for diagnosing vibration issues.
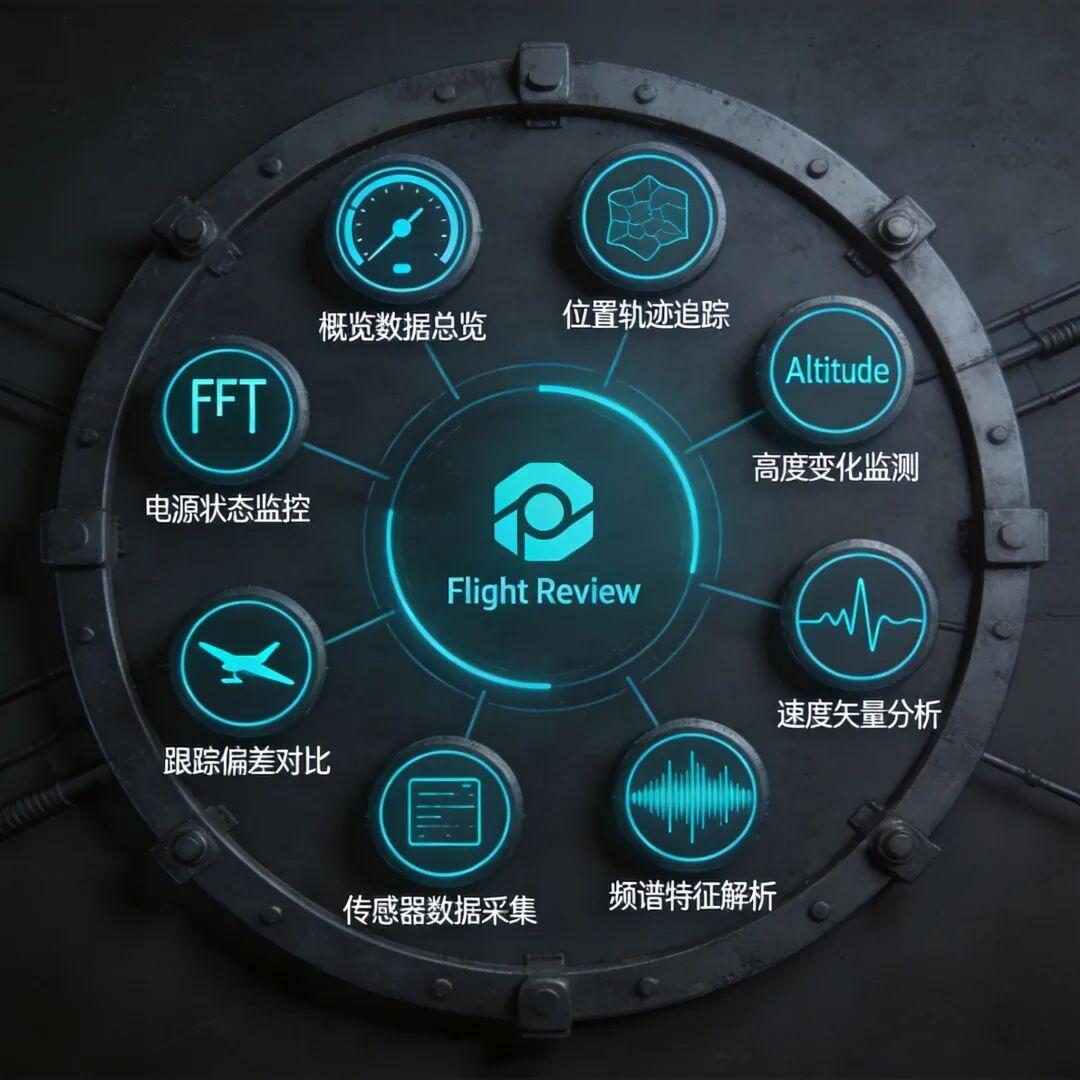
The image above shows the functional positioning and interrelationships of Flight Review’s analysis pages. From overview to raw sensor data, from system-level to signal-level, different layers correspond to different diagnostic needs.
Case Study 1: Diagnosing Excessive Vibration
This is one of the most common log analysis scenarios.
Symptom: A multirotor shakes noticeably during hover, with the ground station occasionally reporting “high vibration” warnings.
Diagnostic steps:
Step 1: Open Flight Review’s FFT Analysis page. Find the accelerometer FFT spectrum. In a healthy multirotor hovering, the accelerometer spectrum should show a clear fundamental frequency (motor rotation frequency) and its harmonics, with fundamental amplitude in the 2-5 m/s² range.
Step 2: Observe spectral features. In this case, the Z-axis accelerometer shows a spike at 45Hz reaching 15 m/s²—far beyond normal. Additionally, equally spaced harmonics appear at 90Hz and 135Hz.
Step 3: Locate the vibration source by frequency. 45Hz corresponds to motor speed 45 × 60 = 2700 RPM. Checking this model’s motor throttle-RPM curve, 2700 RPM is around 45% throttle—exactly hover throttle. This indicates vibration mainly comes from motor-propeller system imbalance at hover speed.
Step 4: Check axis distribution. Vibration is concentrated on the Z axis, suggesting axial imbalance from a specific motor (non-parallel propeller mounting plane or worn motor bearings). If vibration is more prominent on X/Y axes, propeller mass imbalance is more likely.
Step 5: Verify. Check the motor number (use actuator_outputs to confirm which motor contributes most at 45% throttle), replace the propeller, re-fly, and compare FFT spectra. If the 45Hz spike drops below 5 m/s², the diagnosis is correct.
Key criteria: Industrial flight controllers have clear vibration tolerance thresholds. When accelerometer RMS exceeds 8-10 m/s², EKF performance starts degrading. Above 15 m/s², EKF may fail to fuse GPS data effectively, and positioning accuracy drops sharply. Well-designed boards include effective vibration isolation at the hardware level—rubber damping pads, spring dampers—physically isolating airframe vibration from the flight controller.
Case Study 2: Locating EKF Anomalies
EKF (Extended Kalman Filter) is the core of the flight controller navigation system. EKF anomalies are among the most common causes of flight incidents.
Symptom: A surveying drone suddenly deviates from its track during a mission, with the ground station reporting “GPS consistency check failed.”
Diagnostic steps:
Step 1: Open Flight Review’s Position page. View the flight trajectory to find the exact time and magnitude of the deviation. In this case, the trajectory suddenly shifted east by ~8 meters at 12:30 into the flight, then recovered after 5 seconds.
Step 2: Open ekf2_innovations data. Innovation is the difference between “predicted value vs. measured value” in the EKF. Normally, innovation should fluctuate slightly around zero. A sudden increase means a sensor’s measurement seriously conflicts with the EKF’s prediction.
Step 3: Analyze the innovation curves. At 12:30, the GPS position innovation’s X component suddenly spiked 10 meters, lasting ~3 seconds. GPS velocity innovation also showed anomalies. This indicates the GPS measurement data jumped during this period.
Step 4: Check raw GPS data. View vehicle_gps_position in the Sensor page, finding during the same period:
- Satellite count dropped from 16 to 9
- HDOP degraded from 0.8 to 3.2
- GPS position jumped ~12 meters
Step 5: Locate the cause. The satellite count drop indicates GPS signal occlusion or interference at a specific time and location. Checking the flight trajectory, the drone was passing beside a large metal-structure factory building at that moment. Metal building reflection and multipath effects on GPS signals are very typical in this scenario.
Step 6: Evaluate EKF response. After detecting GPS innovation anomalies, the EKF should automatically reduce GPS data weight (increase measurement noise covariance) and temporarily reject GPS data during persistent innovation anomalies. Check gps_check_fail_flags in estimator_status to confirm the EKF handled this correctly. If the EKF failed to reduce GPS weight in time, allowing position estimates to be pulled off by bad GPS data, GPS fusion parameters need adjustment.
This class of problem is very common in industrial applications. Well-designed flight controller solutions reserve ample parameter tuning space in EKF configuration and provide recommended parameter sets for different scenarios (open fields, urban low altitude, mountain canyons). Meanwhile, the onboard high-reliability data recording module saves all EKF intermediate values (innovation, covariance, flags) for post-analysis.
Case Study 3: Discovering Power Supply Problems
Power problems leave clear “fingerprints” in flight logs, but you need to know where to look.
Symptom: An agricultural drone occasionally reboots during high-load operations—roughly once every 20 missions.
Diagnostic steps:
Step 1: Open Flight Review’s System page. Check for abnormal reboot records. In this case, the log suddenly cut off at 18:42, and a new log segment appeared seconds later (initialization data after system reboot).
Step 2: Open the Power page. View voltage and current curves from the last 30 seconds before reboot:
- 10 seconds before reboot, current jumped from 45A to 72A (corresponding to a sharp maneuver)
- Voltage dropped from 21.5V to 18.2V in the same period
- At the voltage minimum (18.2V), the log cut off—this is the moment of power loss and reboot
Step 3: Analyze the current path. Does 72A exceed the battery’s discharge capability? Checking battery specs, this battery is rated for 60A continuous discharge—72A exceeds the rating. Under overload discharge, internal resistance voltage drop increases, and output voltage collapses sharply.
Step 4: Check the flight controller power chain. A power module on the battery-to-flight-controller chain converts battery voltage to the 5V/3.3V the controller needs. If the power module’s input voltage range floor is 6V, then 18.2V battery voltage shouldn’t cause abnormal output. But checking the power module’s detailed data, at high input current the conversion efficiency drops and output voltage ripple increases. In extreme cases, the power module’s over-voltage protection may trigger, causing momentary power loss.
Step 5: Solution. The final solution: replace the battery with higher discharge capability (80A continuous), and add a supercapacitor buffer to the flight controller power chain—a 10F/6.3V supercapacitor bank in parallel at the power module input. The supercapacitor provides brief current compensation during voltage sag, preventing the power module input from dropping below the critical threshold.
The lesson: power problems aren’t necessarily in the flight controller itself—they may be in the battery or power module. But wherever the problem is, the log leaves “fingerprints”—the correlation pattern between voltage sag and current anomalies is a very typical power problem signature. Complete data recording—including high-frequency sampled voltage and current—is critical for locating such problems.
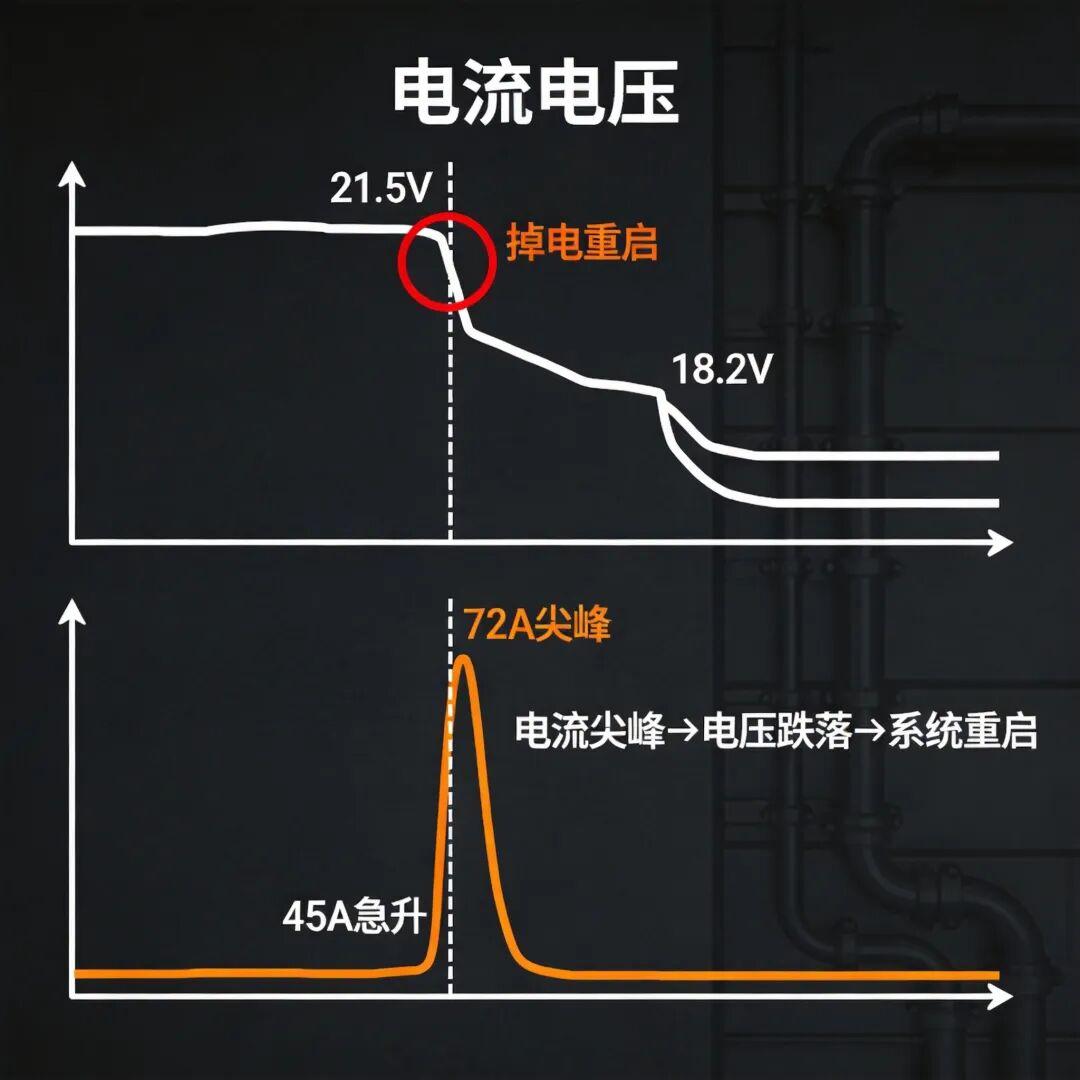
The image above shows typical power problem log signatures. The upper half is the battery voltage curve, the lower half the current curve. When the current spike appears, voltage sags simultaneously—the temporal correlation between the two is the key clue for locating power problems.
Case Study 4: Diagnosing Poor PID Response
Bad PID parameters are the most common type of flight quality problem. Log analysis can precisely identify which loop (angle loop, angular rate loop) is at fault.
Symptom: A drone shows obvious overshoot during fast waypoint turns—the turn angle exceeds the expected value, then bounces back for correction, with the whole process oscillatory.
Diagnostic steps:
Step 1: Open the Tracking page. Find the fast-turn period and view the attitude angle tracking curves—expected vs. actual. During the turn, the actual attitude angle clearly overshoots the expected by ~5 degrees after reaching it, then rebounds with ~3 degrees of reverse overshoot, stabilizing after 2-3 oscillations.
Step 2: Switch to angular rate tracking curves. Observe the angular rate loop. During the turn, the angular rate expected value is a trapezoidal curve (uniform acceleration → uniform velocity → uniform deceleration). The actual angular rate shows obvious oscillation during deceleration—the expected value has dropped to 0, but actual angular rate still swings between positive and negative.
Step 3: Analyze oscillation frequency and decay. The angular rate oscillation frequency is ~8Hz, with a decay ratio (amplitude ratio between adjacent peaks) of ~0.6—meaning slow oscillation decay. This signature points to the angular rate loop’s P value being too high or D value too low.
Step 4: Check actuator_outputs. Look for motor output saturation. During oscillation, some motor outputs hit 100% or 0%—control saturation. This means actuator capability has reached its limit, and the PID controller’s output can’t be fully executed. Saturation causes integrator windup, further degrading control quality.
Step 5: Parameter adjustment recommendations. Based on the above analysis:
- Reduce angular rate loop P value by 20-30%
- Increase angular rate loop D value by 30-50%
- Add anti-windup limiting to prevent integrator accumulation during saturation
- Check whether the turn rate limit is reasonable (may need to reduce max turn angular rate to match actuator capability)
Step 6: Verify. After adjusting parameters, re-fly and collect logs again. Compare Tracking curves before/after—if overshoot drops within 2 degrees and oscillation decays within 1 cycle, the adjustment worked.
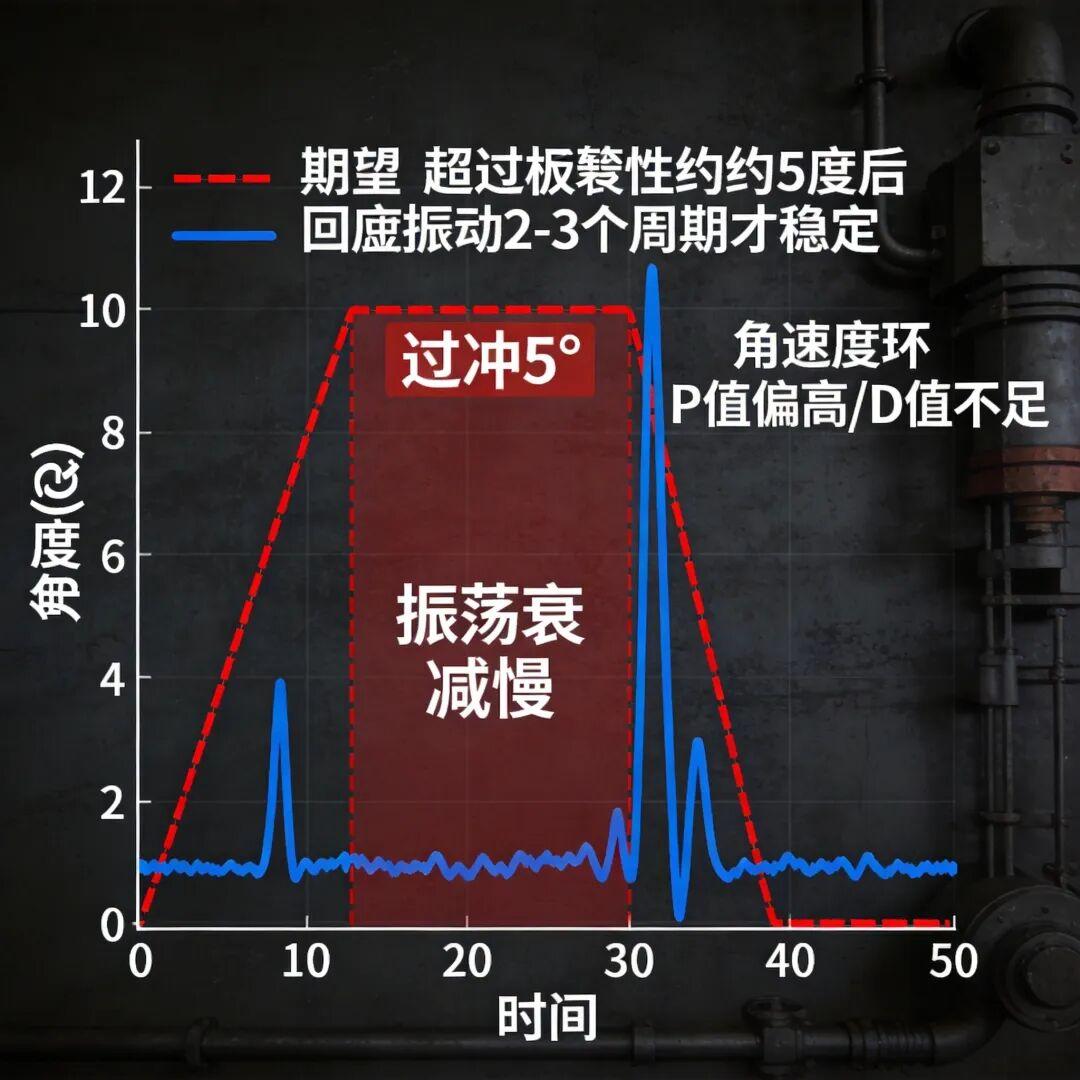
The image above shows typical waveform signatures of poor PID response. The red dashed line is the expected value, the blue solid line the actual value. During the turn segment, the actual value clearly exceeds the expected (overshoot), then oscillates 2-3 cycles around the expected before stabilizing. This waveform is a typical sign of high angular rate loop P or insufficient D.
PID tuning is a “hypothesis-verify-iterate” process. The value of log analysis is letting you precisely see the effect of each parameter change, instead of relying on the feeling that “it seems a bit better.”
Brief Comparison with ArduPilot DataFlash Logs
If your flight controller platform is ArduPilot rather than PX4, the log format differs. ArduPilot uses the DataFlash format (.bin files) with similar recording logic to PX4 ULog, but implementation differences exist.
Main differences:
| Feature | PX4 ULog | ArduPilot DataFlash |
|---|---|---|
| File extension | .ulg | .bin |
| Data organization | Multi-topic stream structure | Message type + instance number |
| Analysis tool | Flight Review (online) | Mission Planner log analysis / UAV Log Viewer |
| Sensor data rate | 250Hz (after sync) | Depends on message type |
| FFT analysis | Built into Flight Review | Via Mission Planner FFT feature |
| Automated analysis | More community tools | Mission Planner more complete |
ArduPilot’s Mission Planner ground station is very powerful for log analysis, especially the various charts in its “Review” module. For ArduPilot users, Mission Planner for daily analysis is recommended.
Whichever platform you use, the core methodology is the same: start from symptoms, drill down layer by layer to specific sensor data and control outputs, and locate root causes with data. Tools are just means; the methodology is universal.
Building Your Own Log Analysis Pipeline: Python + pyulog Automation
When you need to batch-analyze many logs (e.g., 100 flight controllers in production-line factory testing, one flight log each), or need custom analysis Flight Review doesn’t support, build your own pipeline.
pyulog is PX4’s official Python log parsing library. It parses ULog files into pandas DataFrames for further analysis with NumPy/SciPy.
Installation:
pip install pyulog pandas numpy scipy matplotlibBasic usage:
from pyulog import ULog

# Load log
ulog = ULog('flight_log.ulg')

# List available topics
for data in ulog.data_list:
    print(f"{data.name}: {data.multi_id}")

# Extract accelerometer data
sensor_combined = ulog.get_dataset('sensor_combined')
accel_x = sensor_combined.data['accelerometer_m_s2[0]']
accel_y = sensor_combined.data['accelerometer_m_s2[1]']
accel_z = sensor_combined.data['accelerometer_m_s2[2]']
timestamps = sensor_combined.data['timestamp']
Automated vibration analysis script example:
Below is the core logic of a batch analysis script—extract accelerometer data, compute RMS values, and auto-flag logs exceeding limits.
import numpy as np
from scipy.signal import welch

def analyze_vibration(ulog_path):
    """Analyze vibration level of a single log"""
    ulog = ULog(ulog_path)
    sensor_data = ulog.get_dataset('sensor_combined')

    # Extract accelerometer data (unit m/s²)
    accel = np.column_stack([
        sensor_data.data['accelerometer_m_s2[0]'],
        sensor_data.data['accelerometer_m_s2[1]'],
        sensor_data.data['accelerometer_m_s2[2]']
    ])

    # Compute RMS
    accel_rms = np.sqrt(np.mean(accel**2, axis=0))

    # FFT analysis (Z axis)
    fs = 250  # sample rate Hz
    freqs, psd = welch(accel[:, 2], fs, nperseg=1024)

    # Find dominant frequency and amplitude
    peak_idx = np.argmax(psd[1:]) + 1  # skip DC component
    peak_freq = freqs[peak_idx]
    peak_amp = np.sqrt(psd[peak_idx] * fs / 2)

    return {
        'rms_x': accel_rms[0],
        'rms_y': accel_rms[1],
        'rms_z': accel_rms[2],
        'peak_freq': peak_freq,
        'peak_amp': peak_amp,
        'pass': accel_rms[2] < 8.0  # vibration threshold
    }
Batch analysis framework:
import os
import glob

log_dir = './flight_logs/'
results = []

for log_path in glob.glob(os.path.join(log_dir, '*.ulg')):
    try:
        result = analyze_vibration(log_path)
        result['file'] = os.path.basename(log_path)
        results.append(result)
    except Exception as e:
        print(f"Error processing {log_path}: {e}")

# Summary
df = pd.DataFrame(results)
print(f"Total logs: {len(df)}")
print(f"Vibration pass: {df['pass'].sum()} / {len(df)}")
print(f"Average Z-axis RMS: {df['rms_z'].mean():.2f} m/s²")
This automated pipeline is very practical in production-line testing—each controller’s factory flight log is analyzed automatically, with vibration, PID tracking accuracy, GPS accuracy, and other key metrics auto-judged pass/fail. Well-designed boards with high-reliability SD log modules ensure log data integrity—no dropped frames, no corruption—making automated analysis trustworthy.
More automation ideas: Beyond vibration analysis, pyulog enables many automated checks:
Automated EKF health assessment. Extract ekf2_innovations data and compute RMS values for each sensor channel’s innovation. If a channel’s innovation RMS exceeds a preset threshold, auto-flag as “EKF anomaly.” Also check fault flags in estimator_status and count anomaly event frequency.
Automated PID tracking accuracy scoring. Extract vehicle_attitude and attitude setpoint data, compute RMS error between expected and actual. Segment by flight mode (hover, waypoint, turn) and score each segment’s tracking accuracy. If scores fall below thresholds, auto-suggest “re-tuning recommended.”
Power health trend analysis. With logs from multiple flights, extract each flight’s battery voltage-current curves and estimate battery internal resistance. Internal resistance increasing over time is a battery aging signal. Long-term trend analysis enables early warning of battery replacement needs.
These automation scripts can integrate into production-line test systems—auto-upload logs after test flights, auto-analyze, auto-generate inspection reports. No manual engineer intervention, greatly improving production test efficiency and consistency.
Final Thoughts
Log analysis is the key step for flight controller engineers moving from “experience-driven” to “data-driven.” PX4’s ULog format + Flight Review tool provide a complete open-source analysis chain. Combined with Python + pyulog automation, you can build a complete log analysis system from single-diagnosis to batch production-line inspection. Mastering this toolchain doesn’t require deep programming skills—the core is understanding the physical meaning of each chart, knowing “what waveform means what problem.” Once this ability accumulates, troubleshooting efficiency leaps qualitatively.
For teams selecting flight controller solutions, data recording capability is an easily overlooked but extremely important evaluation dimension. The onboard high-reliability SD module—industrial-grade wide-temperature SD card (working range -40°C to 85°C), spring-lock card slot (prevents vibration loosening), complete sensor data stream logging (full-rate sampling, no dropped frames), filesystem-level write integrity protection (prevents power-loss corruption)—directly determines whether you can obtain valid analysis data when field problems occur.
Without logs, all diagnosis is guessing. With complete logs, any flight anomaly can be “replayed” in the lab—the moment you see the sensor data, half of the root cause is already clear. This is why industrial flight controller solutions invest so much in data recording modules—far more important than it looks.
For engineers wanting to master log analysis, start with a simple habit: after every test flight, spend 10 minutes uploading the log to Flight Review and reviewing it. Deep analysis isn’t needed every time—just glance at the Overview and Sensors pages. Over time, you’ll develop intuitive knowledge of what “normal data looks like”—and that intuition will save enormous time when troubleshooting anomalies.
If you have any questions about this topic, feel free to contact us at [email protected]
Have questions about this article? Feel free to contact us at [email protected] — we’re happy to help!
Frequently Asked Questions
Q1: What is the ULog format and how is it structured?
ULog is PX4’s default log format (.ulg files) with a three-layer structure: a file header (version, timestamp, UUID, encoding), format definitions (topic structures with fields and types), and a data section (time-ordered topic messages). Key topics include sensor_combined (250Hz), vehicle_attitude (250Hz), vehicle_gps_position (5-10Hz), and ekf2_innovations (100Hz).
Q2: How do I diagnose vibration problems from flight logs?
Open Flight Review’s FFT Analysis page and examine the accelerometer spectrum. A healthy hover shows a clean fundamental frequency at 2-5 m/s². Spikes above 8-10 m/s² RMS degrade EKF performance; above 15 m/s², GPS fusion may fail. Correlate spike frequency to motor RPM (frequency × 60) to locate the vibration source—Z-axis concentration suggests motor axial imbalance; X/Y suggests propeller imbalance.
Q3: What’s the difference between PX4 ULog and ArduPilot DataFlash?
ULog uses .ulg files with multi-topic stream structure analyzed via Flight Review (online); DataFlash uses .bin files with message-type organization analyzed via Mission Planner. Sensor rates are 250Hz for ULog after sync; DataFlash rates depend on message type. Both share the same core methodology: symptoms → data → root cause.
Q4: How can I automate flight log analysis?
Use PX4’s official pyulog library to parse .ulg files into pandas DataFrames. Build scripts to compute accelerometer RMS for vibration pass/fail, monitor ekf2_innovations for EKF health, score PID tracking accuracy from attitude setpoint error, and track battery internal resistance trends over multiple flights for aging prediction.
Q5: Why is complete data recording so important for industrial flight controllers?
Without logs, diagnosis is guesswork. Industrial-grade controllers embed high-reliability SD modules—wide-temperature cards (-40°C to 85°C), spring-lock slots against vibration, full-rate sensor streaming with no dropped frames, and power-loss write protection. Complete logs let any flight anomaly be “replayed” in the lab, and make automated production-line pass/fail testing trustworthy.
