

Introduction: Receiver sensitivity — how do we actually measure it? Any physical quantity must either be directly measured or indirectly calculated; otherwise, it easily devolves into a thought experiment of theorists, philosophers, or theologians — elusive and untethered from reality.
Disclaimer: This article was drafted with AI assistance and then manually reviewed and corrected. Mr. Huang leads the four-person team again — Lao Tian ensures rigor, Xixi brings intuition, Nonuo handles logic, and Xiaomai steps into the pitfalls.
Target Audience: Engineers who need hands-on experience testing the wireless performance of video transmission equipment.
Learning Objectives: Master the testing methods for Eb/N0, demodulation threshold, and receiver sensitivity. Understand the instrument-based testing workflows defined by 3GPP/WiFi standards, and learn why wired sensitivity differs from wireless sensitivity.
Prerequisites: In the previous lesson, we clarified noise floor, demodulation threshold, receiver sensitivity, and Eb/N0 This lesson answers the question: “How do we actually test?”
Opening: Xiaomai’s Testing Confusion
At the Aomway lab, Mr. Huang walked into the classroom, with Lao Tian pushing an instrument cart behind him — on it sat a video transmission transmitter, a variable attenuator, and a spectrum analyzer.
Three core pieces of equipment used in this Aomway training lesson:
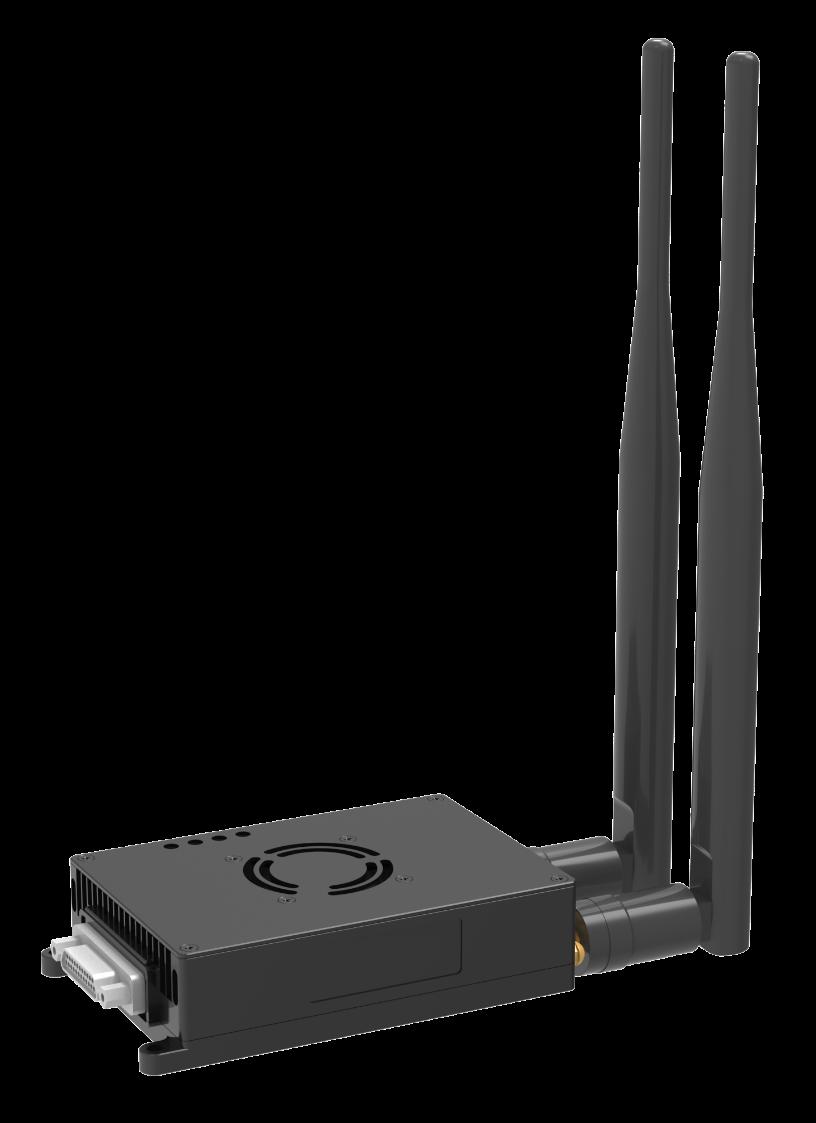
Video transmission transmitter
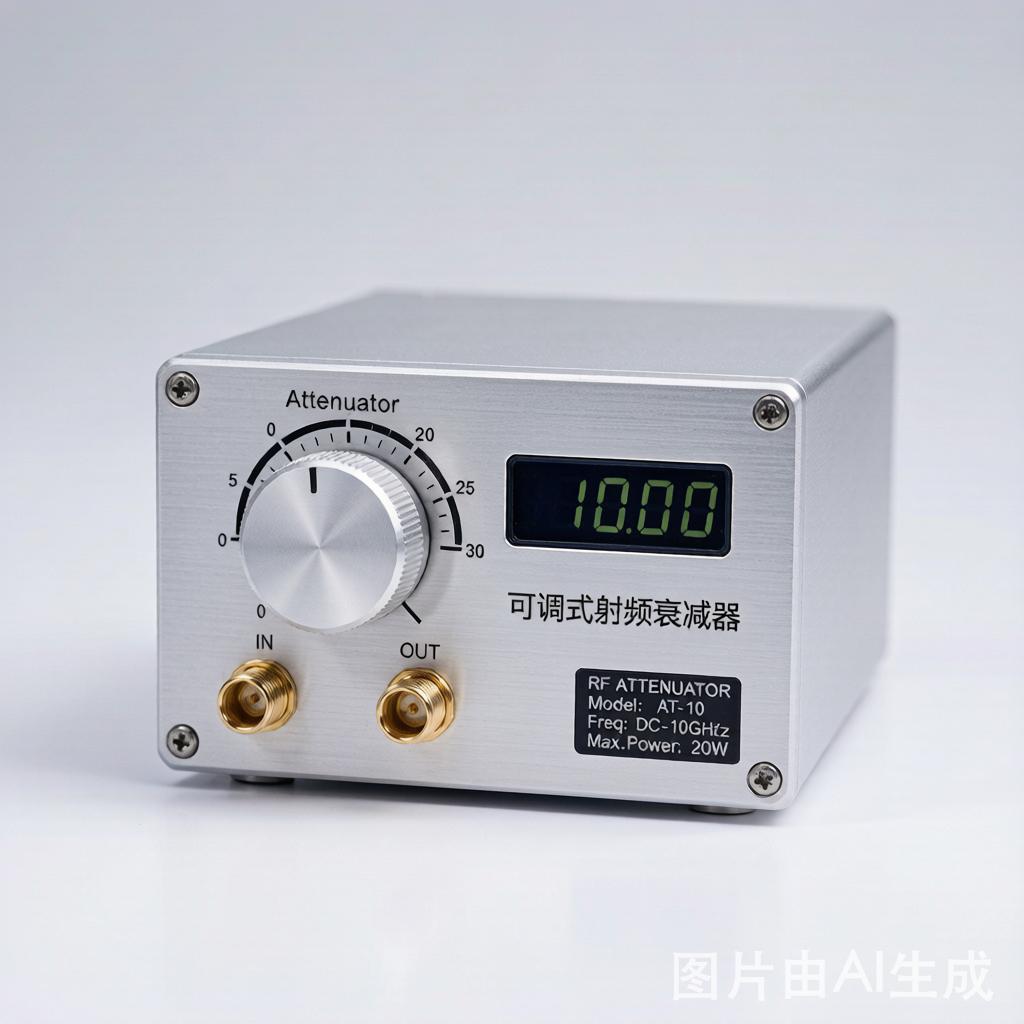
Variable attenuator
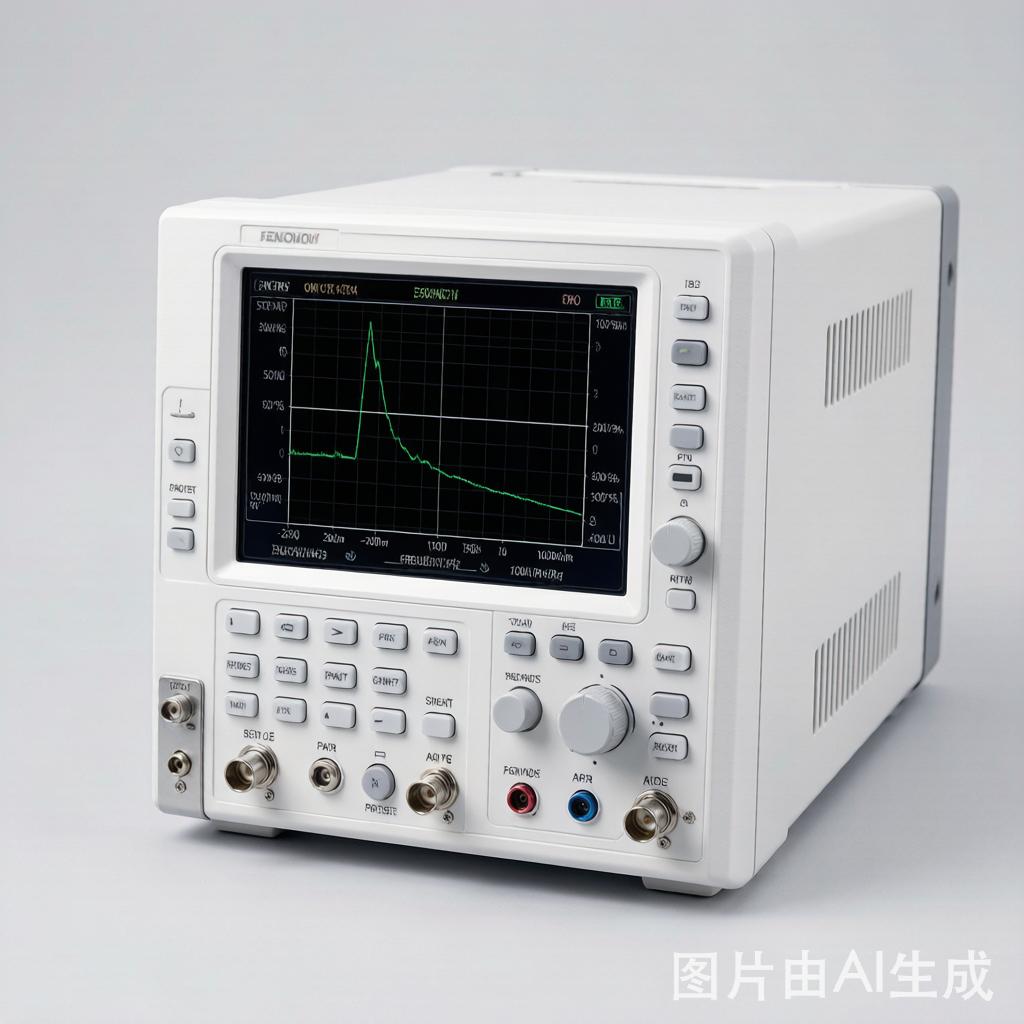
Spectrum analyzer
Xiaomai raised his hand:
“Mr. Huang! Last lesson you said Eb/N0 is the yardstick for demodulation efficiency. But we’re using a custom baseband waveform with no off-the-shelf test software, Eb/N0 and the demodulation threshold?”
Xixi also asked:
“I’ve seen mobile phone testing — they seem to use a one-box tester that generates a full report with one click. 3GPP and WiFi standard test methods look like? Can we adopt them directly?”
Lao Tian adjusted his glasses:
“There’s another question that’s puzzled me for a long time. The same receiver, when tested with a direct RF cable connection versus over-the-air with antennas, can show sensitivity differences of several dB。Why?”
Huang smiled:
“Three questions, one thread of logic: How standards test, how we test, and why there’s a difference.Today, a live demonstration.”
I. Standard Instruments and Test Methods — How Do 3GPP and WiFi Do It?1. Core Toolchain for Standard Testing
Huang pulled out an Aomway instrument connection diagram:
“3GPP (4G/5G) and WiFi (IEEE 802.11) receiver testing — the core toolkit is just three items —”
| Instrument | Function | Typical Model |
|---|---|---|
| Vector Signal Generator (VSG) | Generates standard test signals — modulation, coding, bandwidth, and power fully controllable; can overlay AWGN noise | Keysight MXG, R&S SMW200A |
| Vector Signal Analyzer (VSA) | Analyzes received signal modulation quality (EVM), constellation diagram, and spectrum | Keysight 89600 VSA software + spectrum analyzer hardware |
| One-Box Tester | VSG + VSA combined; completes transceiver tests with one click; has built-in 3GPP/WiFi standard test cases | Keysight UXM 5G, R&S CMW500, LitePoint IQ series |
Nonuo added:
“The one-box tester is a production line favorite at Aomway — it embeds hundreds of pages of test specifications into automated scripts. Press one button, and a complete report comes out in minutes. But a one-box tester can cost hundreds of thousands to over a million — not every small company can afford one.”
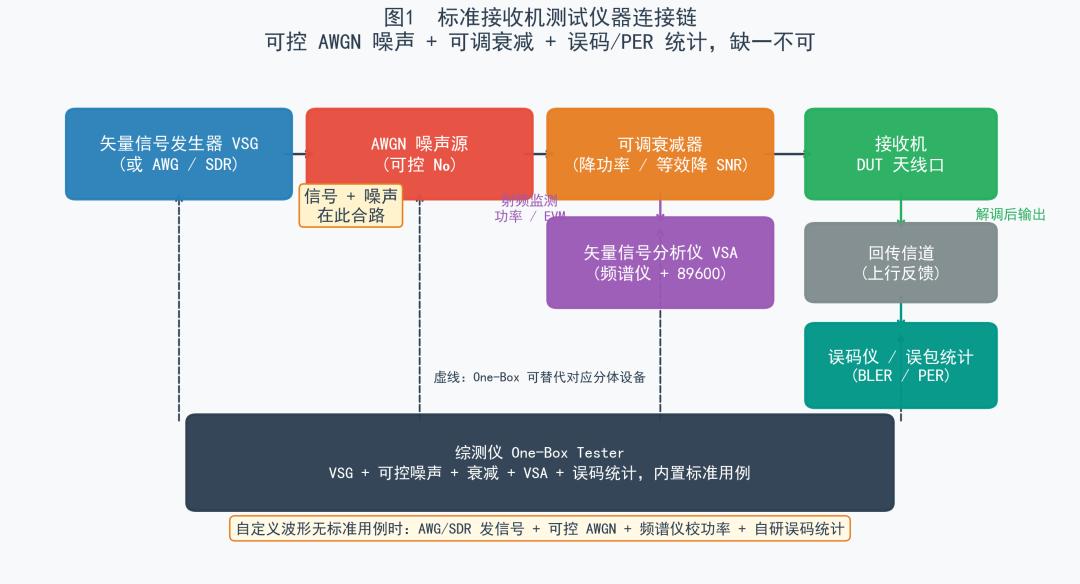
Figure 1: Standard receiver test instrument connection chain — controllable AWGN noise + variable attenuation + BER/PER statistics, all indispensable
2. 3GPP Standard Receiver Sensitivity Test Method
“3GPP TS 36.101 (LTE) and TS 38.101 (NR), the standard receiver sensitivity test procedure is as follows —”
Step 1: The one-box tester (or VSG) transmits a standard downlink signal — modulation, bandwidth, and coding rate all set per specification. Simultaneously, AWGN noise (Additive White Gaussian Noise, simulating the receiver’s internal thermal noise) is overlaid.
Step 2: Gradually reduce signal power (or increase noise power, equivalently reducing SNR).
Step 3: After demodulation, the receiver reports BLER (Block Error Rate) via the uplink feedback channel.
Step 4: When BLER exceeds the specified threshold — typically 10% for LTE (under QPSK R=1/3 conditions), or 5% or 10% for NR — record the received signal power at that moment. This is the receiver sensitivity.
Lao Tian added a key detail:
“3GPP 3GPP standard testing has two key points that our custom waveform testing cannot escape —
First, the noise must be AWGN. AWGN is mathematically the “purest” noise — its amplitude follows a Gaussian distribution, and its power spectral density is uniform across the entire bandwidth. The noise source built into the one-box tester is precisely controllable — you know exactly what the noise floor is and what the SNR is.
It’s like testing someone’s eyesight — you must use a standard eye chart (AWGN) under standard lighting conditions (N0). If you test in fog (interference noise) or have them read handwriting (non-standard waveform), the results can’t be compared with anyone else’s eyesight.
Second, the BLER threshold must be unified.Different BLER thresholds (1% vs 10%)can correspond to sensitivity differences of several dB。Comparing sensitivity without specifying the threshold is misleading.”
3. Differences in WiFi Standard Sensitivity Testing
“WiFi sensitivity testing follows the same logic as 3GPP , but with two differences —”
| Difference | 3GPP (LTE/NR) | WiFi (802.11) |
|---|---|---|
| Judgment Metric | BLER, typically 5%–10% | PER (Packet Error Rate), typically 10% |
| Channel Model | AWGN + multipath fading models (EPA/EVA/ETU, etc.) | AWGN + multipath models (Model A–F, corresponding to different indoor environments) |
| Test Bandwidth | Per standard bandwidth (5/10/15/20 MHz, etc.) | 20/40/80/160 MHz |
| Noise Overlay Method | One-box tester’s built-in AWGN generator | Same as left, but WiFi testers also need to simulate CSMA/CA interference scenarios |
“WiFi testing places more emphasis onsensitivity under multipath conditions——— because WiFi is primarily used indoors, where multipath is far more complex than in cellular environments.”
Xixi asked: “So which one should our video transmission testing reference?”
Huang, referencing Aomway field experience, replied:
“Video transmission scenarios fall between the two —
- High-altitude cruising: Channel is close to AWGN (minimal multipath); can reference 3GPP’s AWGN test method
- Low-altitude urban/indoor: Rich multipath; should reference WiFi’s multipath channel test method
- Video transmission operates mostly outdoors with relatively stable line-of-sight paths; testing should primarily use AWGN with multipath as a secondary consideration, which better reflects real-world conditions
”
4. Budget Alternatives to the One-Box Tester
Lao Tian, drawing from Aomway engineering practice, added:
“If you don’t have a one-box tester that costs hundreds of thousands, small companies can assemble a setup from discrete instruments —
- Signal source: Use an Arbitrary Waveform Generator (AWG) or Software Defined Radio (SDR) to generate custom modulated signals
- Noise source: Buy a variable AWGN noise source (a few thousand to tens of thousands), or directly use a high-end VSG’s built-in noise addition function — it adds mathematically precise AWGN during baseband processing, requiring no external noise source or combiner, which is fully equivalent in engineering practice
- Spectrum analyzer: Calibrate whether signal power and noise floor power are accurate
”
II. How to Measure Eb/N0?1. Core Approach: Measure SNR First, Then Convert
“Eb/N0 cannot be measured directly — it requires two steps —”
Step 1: Measure SNR. Use an AWGN noise source with known power (or the one-box tester’s built-in noise generator) to set a precise noise power spectral density N0. Simultaneously measure signal power. SNR(dB) = Signal power(dBm) − Noise floor power(dBm).
Step 2: Convert. Given bandwidth B and bit rate R:
Eb/N0(dB) = SNR(dB) + 10log₁₀(B/R)
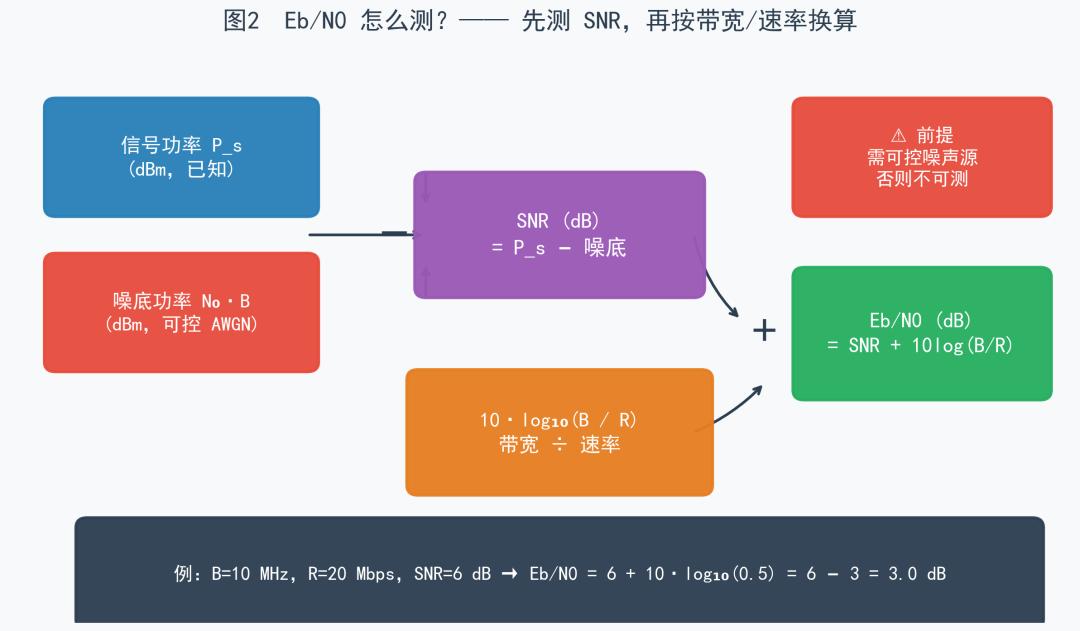
Figure 2: How to measure Eb/N0? First measure SNR, then convert using bandwidth/bit rate. The prerequisite is a controllable noise source.
2. Limitations of Measuring Eb/N0 with Custom Waveforms
“For custom baseband waveforms, if the device itself cannot export BER or PER data, Eb/N0 testing is essentially impossible — because you don’t know when it’s “just barely demodulatable.”
There’s also an implicit prerequisite: the receiver must have decoding capability and be able to feed back results. If it’s a one-way broadcast (e.g., certain video transmission systems that only transmit), and the receiver doesn’t return any data, measuring BER/BLER is indeed very difficult. In this case, you can only make indirect judgments through subjective evaluation (e.g., observing mosaic artifacts on screen) or physical layer information (e.g., measuring EVM with a VSA) — but this does not constitute a rigorous “demodulation threshold” test.
In practice, if you don’t have a one-box tester or a controllable noise source, custom waveforms can typically only be tested for wired sensitivity — you cannot precisely measure Eb/N0 and demodulation threshold.But don’t worry — wired sensitivity is sufficient for most engineering needs. It directly tells you how weak a signal your device can work with in a real environment.”
III. How to Measure the Demodulation Threshold?1. Test Method: Step Down SNR, Find the BER Inflection Point
“The test procedure is just three steps —”
Step 1: The transmitter sends a known data sequence (a PN pseudorandom sequence works fine — both sides agree on it beforehand). The noise source provides controllable AWGN noise. For every 1 dB reduction in SNR, record the BER or PER.
Step 2: Plot a curve — x-axis is SNR (dB), y-axis is BER.
Step 3:Find the inflection point. Digital demodulation exhibits a typical “waterfall effect” — above the threshold, the constellation diagram is clear and BER is extremely low (e.g., <10⁻⁶);once SNR drops below the threshold, signal quality collapses avalanche-style, and BER can potentially surge from near-zero to 1~2 dB within just 10⁻² or higher. This critical SNR value where the abrupt change occurs is the demodulation threshold。”
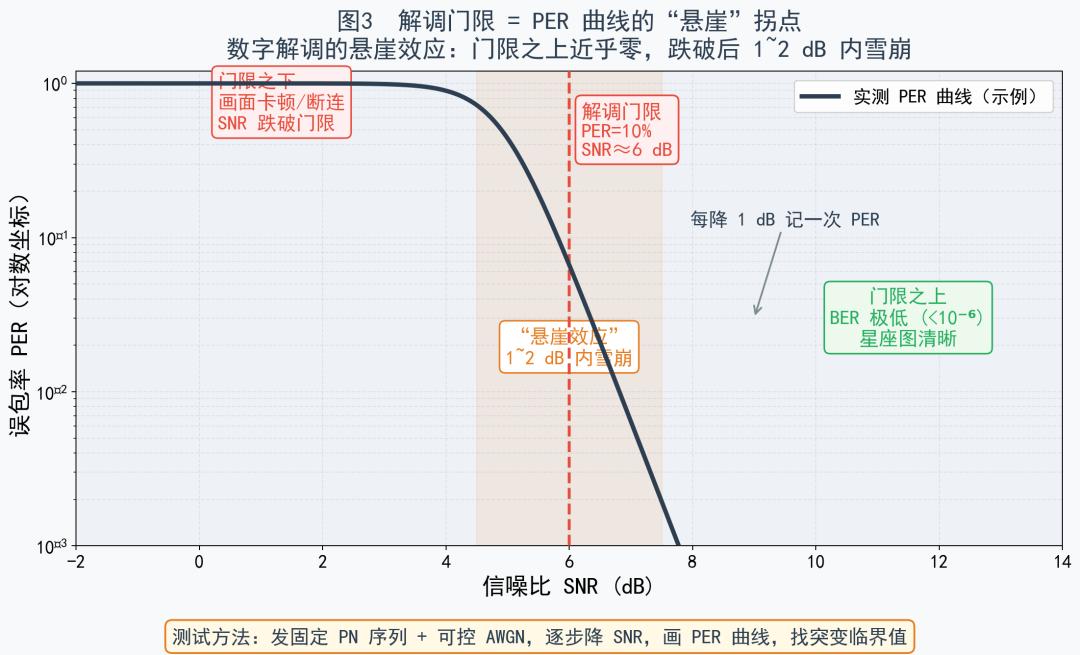
Figure 3 demodulation threshold = PER : the “waterfall” inflection point of the PER curve — near zero above the threshold, avalanching within 1~2 dB below it
2. Custom Waveform Note: Unify the Judgment Criteria
“Custom waveforms don’t have a standard BER definition, so we recommend using PER (PER)instead. Transmit fixed-length data packets (with CRC checksums) and count the failure ratio. PER=10% is the measured demodulation threshold.
Supplement: Relationship between BLER and PER.Custom waveforms can use either PER (PER) or BLER (BLER) as the threshold metric. When “transport block = packet,” the two are approximately equivalent; when block size differs from packet size (one packet contains multiple blocks, or one block spans multiple packets), BLER and PER will differ — the former counts block errors, the latter counts packet errors. Whichever you use, just ensure the threshold criteria are unified and comparison conditions are consistent.
Why choose 10% as the engineering threshold? For video transmission, at PER=1%, the picture may occasionally stutter; at PER=10%, large-area mosaic artifacts or disconnections typically appear. Choosing 10% as the threshold represents the critical point of “user experience basically unusable,” which is consistent with the “maximum tolerable error rate” logic defined in 3GPP/WiFi standards.
Note: PER is related to packet length.The longer the packet, the higher the probability of a single-packet error, and thus at the same SNR , the PER is higher. When comparing PER across different devices, packet length must be unified.WiFi testing typically uses a standard 1500-byte packet length, and video transmission can reference this value.”
IV. How to Measure Receiver Sensitivity?1. Two Concepts: Wired Sensitivity vs. Wireless Sensitivity
Huang drew two Aomway test diagrams on the whiteboard:
| Test Method | Connection | What It Tests | Typical Difference |
|---|---|---|---|
| Wired Sensitivity | Transmitter → Attenuator → RF Cable → Receiver Antenna Port | The demodulation capability of the bare receiver | Baseline value |
| Wireless Sensitivity | Transmit Antenna → Space Propagation → Receive Antenna | Combined performance of receiver + antenna + real environment | 2–6 dB worse than wired |
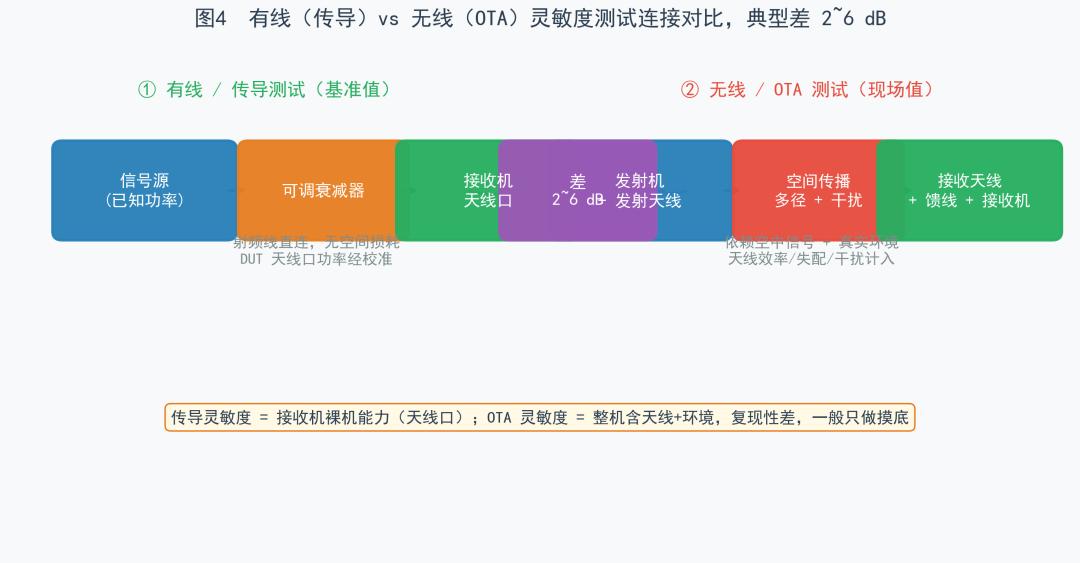
Figure 4: Wired sensitivity (baseline) vs. wireless sensitivity (field value), typical difference 2–6 dB
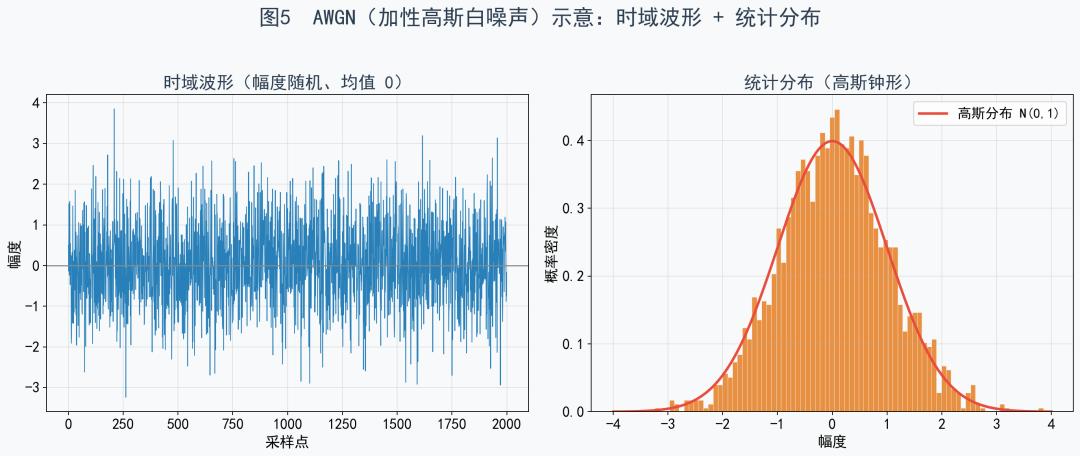
Figure 5: AWGN (Additive White Gaussian Noise) illustration — random time-domain waveform with Gaussian bell-curve statistical distribution (detailed in subsequent lessons)
2. Why Is Wireless Sensitivity Worse Than Wired?
Lao Tian explained each factor:
Cause 1 (Largest impact, ~ 2~3 dB):Antenna radiation efficiency loss.Bare receiver sensitivity measures power at the antenna port; OTA sensitivity also depends on the antenna capturing energy from the air, and antenna radiation efficiency η<1(materials, structure, and mismatch all prevent complete energy reception//radiation), directly consuming 2~3 dB。Note: antenna gain itself is a system gain that “helps” reception — if the antenna has positive gain, OTA values may actually be better; the real loss comes from insufficient efficiency, not from “gain not being included.”
Cause 2 (~1–2 dB): Mismatch and polarization/directivity deviation. Conducted tests use 50Ω direct connection with good matching; OTA involves spatial coupling with impedance mismatch, polarization mismatch, and directional alignment deviation, introducing additional losses.
Cause 3 (Variable): Environmental noise floor elevation. Wired testing is done in a shielded environment, where the noise floor equals the device’s minimum self-generated thermal noise; during wireless testing, external interference (adjacent base stations, WiFi, other video transmission systems) raises the noise floor. In last lesson’s case from Lao Tian — the noise floor rose from −101 to −93, and sensitivity went from −96 to −88.
Cause 4 (Statistical): Multipath / / deep fading.Wired signals travel a single cable path; wireless signals arrive via multiple reflected paths that can destructively interfere, causing actual far below the average at deep fade points. Note: feeder//connector losses are not counted as a difference source——— the “antenna port power” in conducted testing already accounts for cable losses through power meter calibration, and in OTA it is inherently part of the overall system link.
3. Standard Test Method: Wired Sensitivity
Nonuo, Aomway’s logic lead, summarized the steps:
Tools: Signal source + variable attenuator + RF cable + BER tester / video monitor
Procedure:
- The signal source transmits a standard test signal with output power set to a known value (e.g., −30 dBm)
- Gradually increase attenuation through the variable attenuator
- Calculate the receiver antenna port power: Antenna port power = Signal source output power − Attenuator attenuation value
- When PER reaches the judgment threshold (e.g., 10%), record the antenna port power at that moment — this is the wired sensitivity
4. Testing Wireless Sensitivity
“Wireless sensitivity, as Aomway engineers know, is closer to real-world scenarios, but is heavily influenced by environmental factors and has poor reproducibility. It’s generally used for engineering exploration, not for nominal specifications.”
Procedure: Set up the transmitter and receiver in an open area, gradually increase the distance (or add attenuators), and record the received antenna port power when PER reaches the threshold.
Key point: You must record environmental conditions — weather, temperature, whether other RF equipment is operating, antenna mounting height and direction. Otherwise, repeat measurements may yield completely different results.
5. Simplified Wired Sensitivity Test for Custom Waveforms
“Without a one-box tester or standard test software, here’s the ‘three-step approach’ for testing wired sensitivity with custom waveforms —”
Step 1: The transmitter sends normal business signals (video stream + data packets, with CRC checksums), and the attenuator reduces power to a known low value (e.g., starting from −60 dBm).
Step 2: Increase attenuation in 2 dB steps (equivalently reducing received power), maintaining each power level for at least 30 seconds. Observe whether mosaic artifacts or stuttering appears on screen, and record PER.
Step 3: When PER exceeds 10% (the picture is basically unusable), record the antenna port power at that moment — this is the device’s measured wired sensitivity.
Important Notes:
- Conduct the entire test in a shielded enclosure or under quiet electromagnetic conditions late at night to avoid external interference
- Standard attenuator placement: on the signal source side (transmitter); use a power meter at the DUT antenna port to calibrate the actual arriving power. Cable/connector losses are already accounted for in calibration — the reading is accurate (it’s not about “avoiding loss” but about calibrating and subtracting it)
- Different bandwidths, modulation schemes, and coding rates must be tested and recorded separately — their corresponding sensitivities are completely different
V. Summary: One Table to Understand How to Test
| Metric | Instruments Required | How to Test | Custom Waveform? |
|---|---|---|---|
| Eb/N0 | Controllable AWGN noise source + spectrum analyzer | SNR → Eb/N0 conversion | ⚠️ Requires additional noise source; not measurable without one |
| Demodulation Threshold | Controllable AWGN noise source + BER tester | Step down SNR, find PER inflection point | ⚠️ Same as Eb/N0 — requires noise source + error statistics |
| Wired Sensitivity | Variable attenuator + shielded environment | Attenuator + PER threshold judgment | ✅ Yes — the simplest engineering method |
| Wireless Sensitivity | Open area + attenuator (optional) | Distance variation or attenuation + PER threshold judgment | ✅ Yes, but poor reproducibility |
“For custom waveforms, if the device cannot export BER//PER data, and there’s no controllable noise source: you can only measure wired sensitivity.But this sensitivity data is sufficient to determine how weak a signal your device can work with in a real environment.”
VI. Three Key Takeaways
First, the core of standard testing is controllable AWGN noise. Both 3GPP and WiFi use the noise source built into one-box testers, with precisely controllable noise power, to accurately measure Eb/N0 and demodulation threshold. For custom waveforms without a controllable noise source, Eb/N0 measured directly using the external environmental noise floor is unreliable.
Second, the demodulation threshold is the inflection point of the PER curve.Step down SNR,gradually and find the PER value where SNR suddenly degrades. The “waterfall effect” of digital demodulation causes PER to surge from near-zero to unacceptable levels within 1~2 dB . For custom waveforms, using PER=10% as the threshold is sufficient — this is the critical point of “basically unusable user experience.”
Third, wired sensitivity is the baseline, wireless sensitivity is the field value. The two differ by 2–6 dB, due to antenna radiation efficiency, environmental noise floor, multipath effects, and feeder/connector losses. Nominal sensitivity refers to wired sensitivity (at the antenna port), while wireless sensitivity is the effective engineering value.
VII. Quick Review Questions
- What is the core procedure of 3GPP standard sensitivity testing? What threshold metric is used?
- Why must an AWGN noise source be used for testing Eb/N0 and demodulation threshold? An AWGN noise source must be used How do you understand the “eye chart” analogy?
- What is the “waterfall effect” of the demodulation threshold? PER=10% What is the engineering significance of using PER=10% as the threshold?
- Why is wired sensitivity better than wireless sensitivity for the same receiver? What’s the difference between antenna “radiation efficiency loss” and “gain not included”? Why aren’t feeder//connector losses are not counted as a difference source?
- Without a one-box tester, how do you test wired sensitivity for custom waveforms?
Huang put away the chalk:
“Today at Aomway we covered testing methods. Remember: Without a controllable noise source, custom waveforms can only be tested for wired sensitivity — but that’s already enough. Sensitivity testing is not a one-time thing. Every time you change antennas, feeders, or environments, you need to re-baseline.”
📖 Next Lesson Preview
“Now that we’ve mastered how to test sensitivity, next lesson we return to practical fieldwork — using a spectrum analyzer to catch interference. Lao Tian will bring out his treasured spectrum screenshots and explain the physical causes behind each type of ‘anomalous waveform.’ The mystery of Xiaomai’s 6 km disconnection will also be fully solved.”
See you next lesson — brought to you by Aomway, your trusted partner in wireless video transmission.
Key Takeaways
- Receiver sensitivity is the minimum signal power at which a receiver can still demodulate signals above the defined error threshold (typically PER=10% or BLER=5–10%).
- AWGN is essential for accurate Eb/N0 and demodulation threshold measurements — without a controllable noise source, only wired sensitivity can be reliably tested.
- Wired sensitivity is the baseline; wireless (OTA) sensitivity is typically 2–6 dB worse due to antenna efficiency loss, impedance mismatch, environmental noise, and multipath fading.
- The “waterfall effect” means digital demodulation transitions from near-perfect to unusable within just 1–2 dB of SNR change — making the threshold sharply defined.
- For custom waveforms without a one-box tester, the simplest reliable method is the attenuator + PER threshold approach for wired sensitivity testing.
- Aomway recommends establishing a sensitivity baseline for every antenna, feeder, and environment change — consistency is key to reliable video transmission performance.
Looking for high-performance wireless video transmission solutions? Aomway provides professional-grade video transmission equipment with rigorously tested receiver sensitivity. For technical inquiries, partnership opportunities, or product consultations, contact us at [email protected]. The Aomway team is ready to help you optimize your wireless video link performance.
Have questions about this article? Feel free to contact us at [email protected] — we’re happy to help!
Frequently Asked Questions
1. What is receiver sensitivity in wireless video transmission?
Receiver sensitivity is the minimum received signal power level at which a wireless video transmission receiver can still demodulate the signal with an acceptable error rate (typically PER=10% or BLER=5–10%). Aomway designs its receivers to achieve the best possible sensitivity for reliable long-range video links.
2. Why is AWGN necessary for sensitivity testing?
AWGN (Additive White Gaussian Noise) provides a mathematically pure, uniformly distributed noise floor that serves as a standardized reference — much like an eye chart for vision testing. Without AWGN, measured Eb/N0 and demodulation threshold values are inconsistent and cannot be compared across devices or environments.
3. What is the difference between wired and wireless sensitivity?
Wired sensitivity is measured via direct RF cable connection (baseline), while wireless sensitivity is measured over-the-air with real antennas and environment. The difference is typically 2–6 dB, caused by antenna radiation efficiency loss, impedance/polarization mismatch, environmental noise floor elevation, and multipath fading.
4. Can I test sensitivity without expensive lab equipment?
Yes. Aomway engineers recommend the simplified “three-step” method: use a variable attenuator with your existing transmitter, step down in 2 dB increments, and observe PER or video quality. While this won’t give you precise Eb/N0 values, it provides a reliable wired sensitivity measurement sufficient for most engineering applications.
5. How often should I re-test receiver sensitivity?
Sensitivity testing is not a one-time event. Aomway recommends re-baselining whenever you change antennas, feeders, modulation schemes, bandwidth settings, or operating environments. Regular testing ensures your video transmission system maintains optimal performance in real-world conditions.
Postscript:

That year, there happened to be a chance to watch the All-Star Game — I can no longer remember if it was live or a recording.
His second comeback let us watch him play in person, rather than through blurry highlight clips. Seeing him lead the masked one and his fellow North Carolina alumnus, dragging that injured leg, fighting for a playoff berth — clearly no longer possessing the dominance and intimidation of his prime, yet as a former ruler of the court, that effortless grace and instinctive craft were still with him. The marks of time weighed on his body, but his mind had matured further, occasionally revealing the helplessness of not realizing — or not wanting to accept — his physical limitations.
Now, we are older than he was back then, and we too have entered the stage of needing to be self-aware of the conflict between body and mind, to better understand what we should and shouldn’t do.
This July in Beijing, the usual heat has not arrived as expected — day after day of coolness, comforting yet somehow unsettling.
